Physical Network Inventory
SunVizion Physical Network Inventory is the foundation for building and operating a reliable telecom network database. It captures the real, physical world of the network—sites, structures, ducts, cables, fibers, equipment and ports—and connects it into one consistent model, so teams can instantly understand what exists, where it is, how it is connected, and how much capacity is still available.
Instead of keeping separate spreadsheets, drawings and partial GIS layers, you get one operational view that supports day-to-day work across engineering, rollout, service delivery, and field operations.
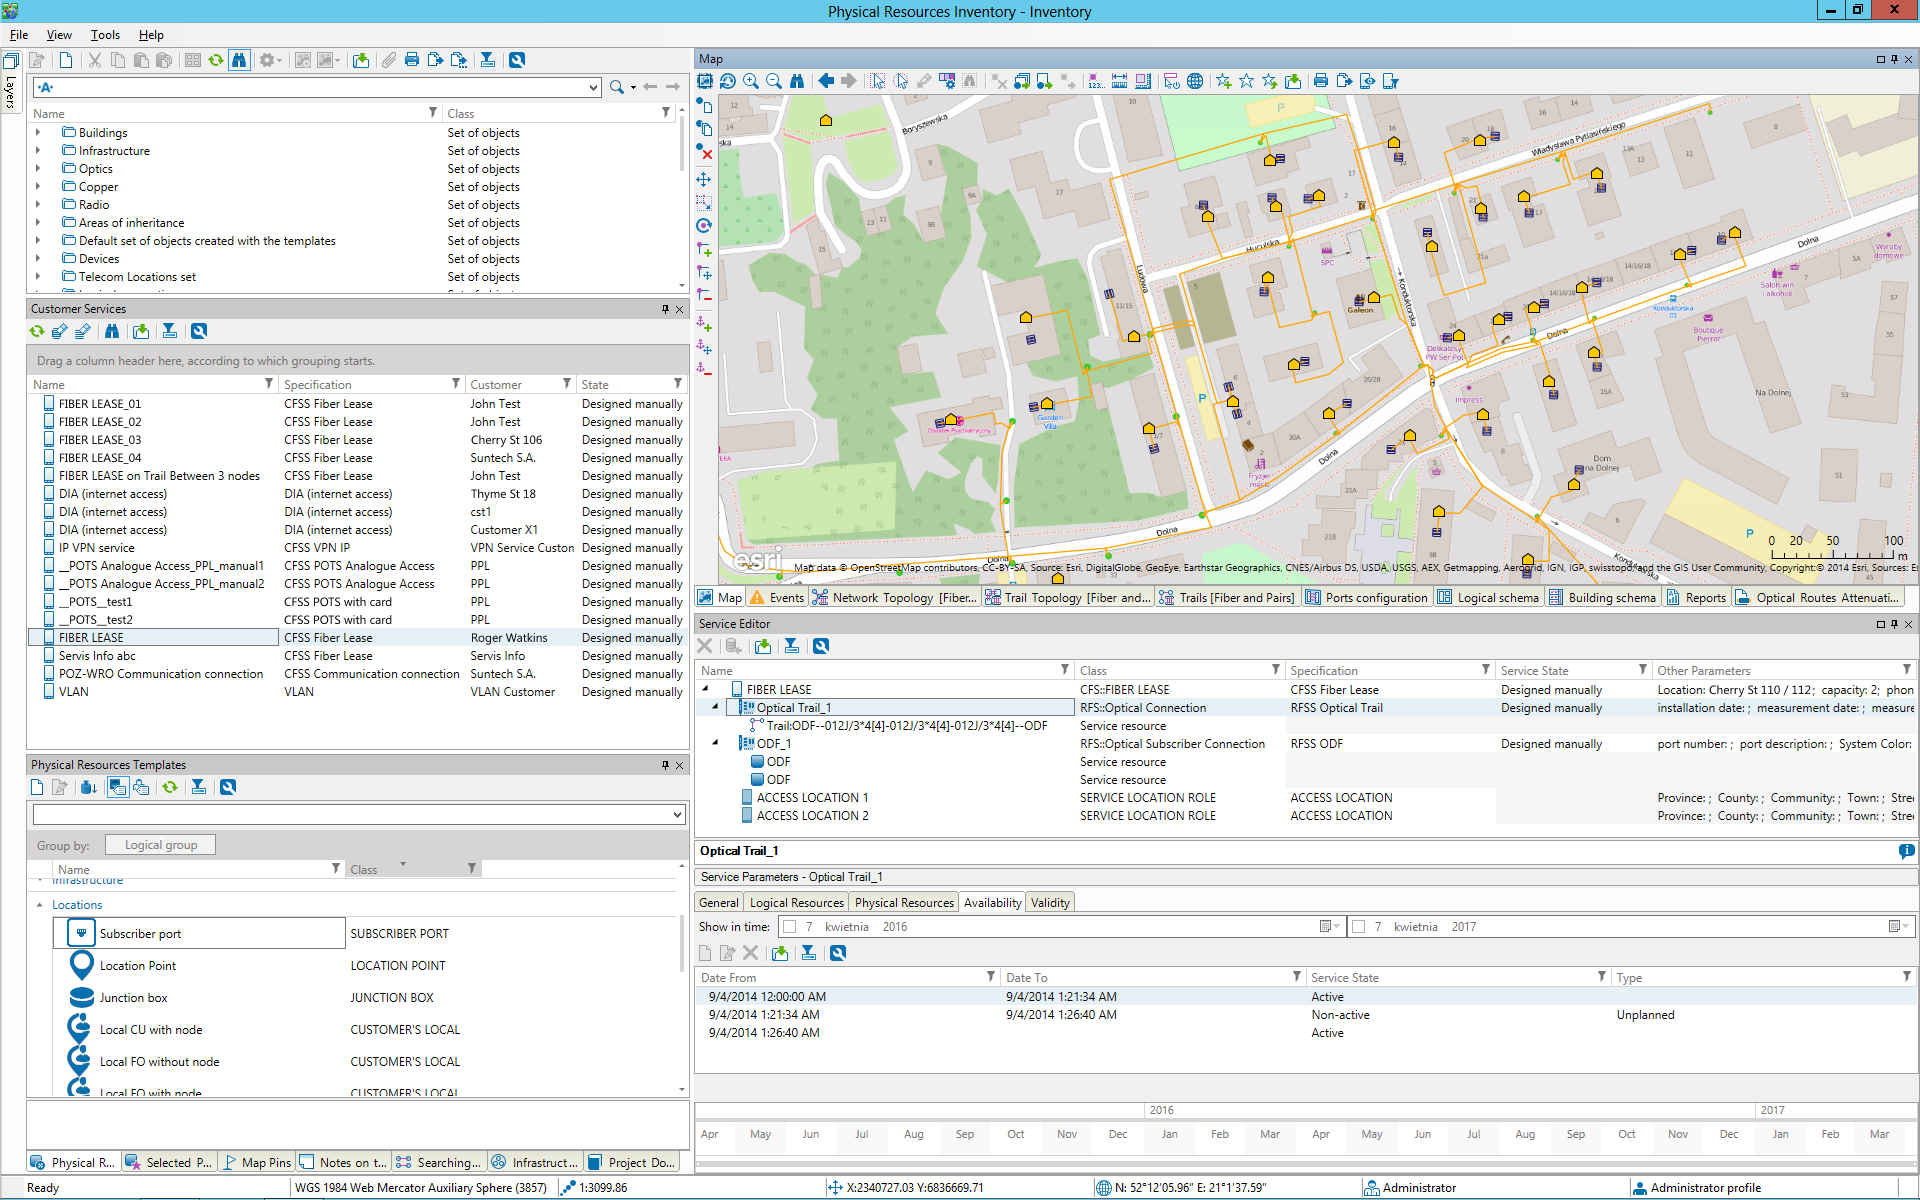
One inventory for Outside Plant and Inside Plant
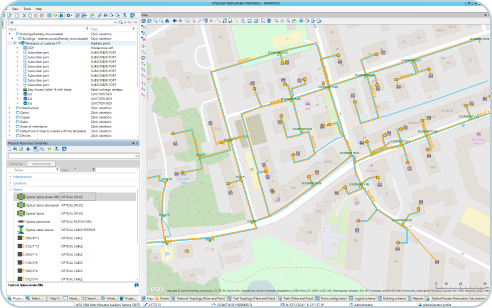
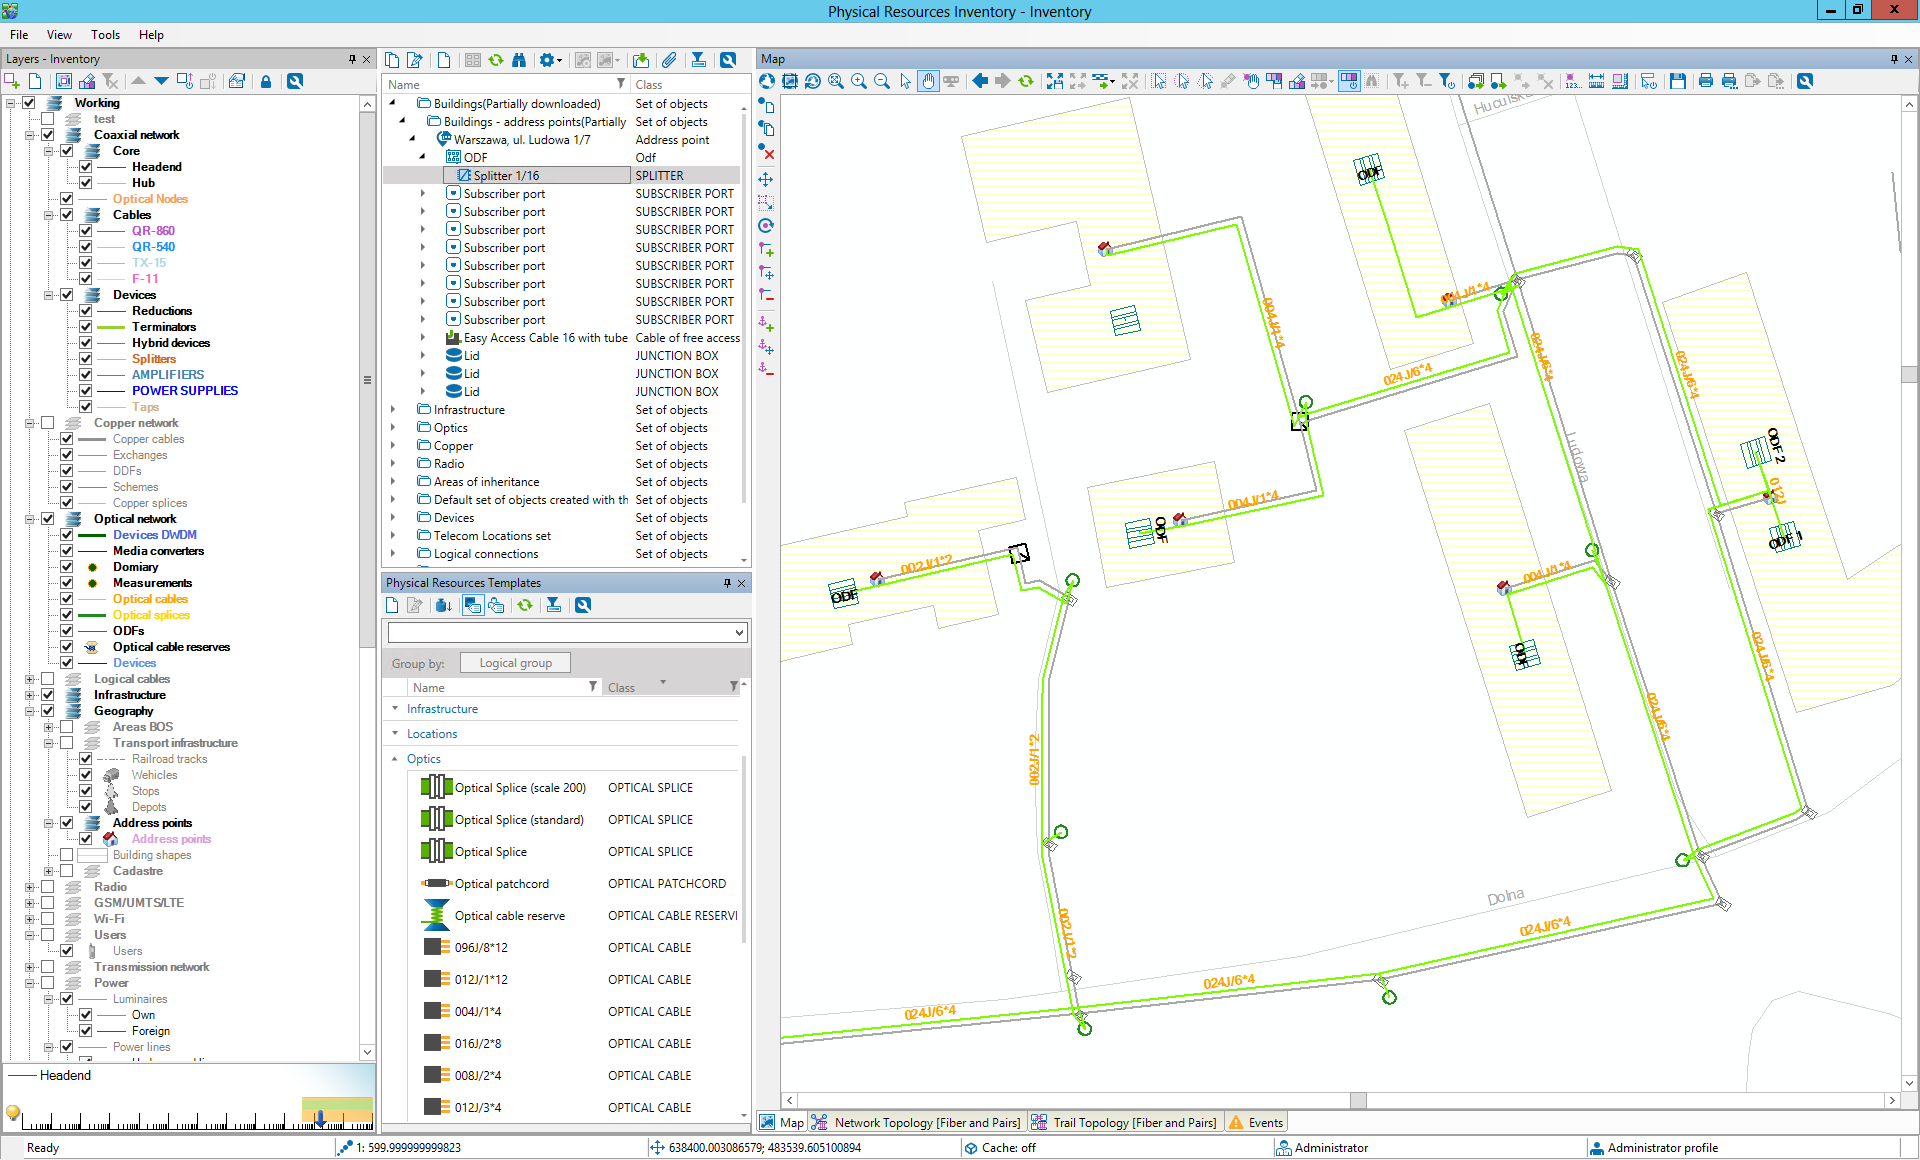
SunVizion lets you manage the physical network across both environments:
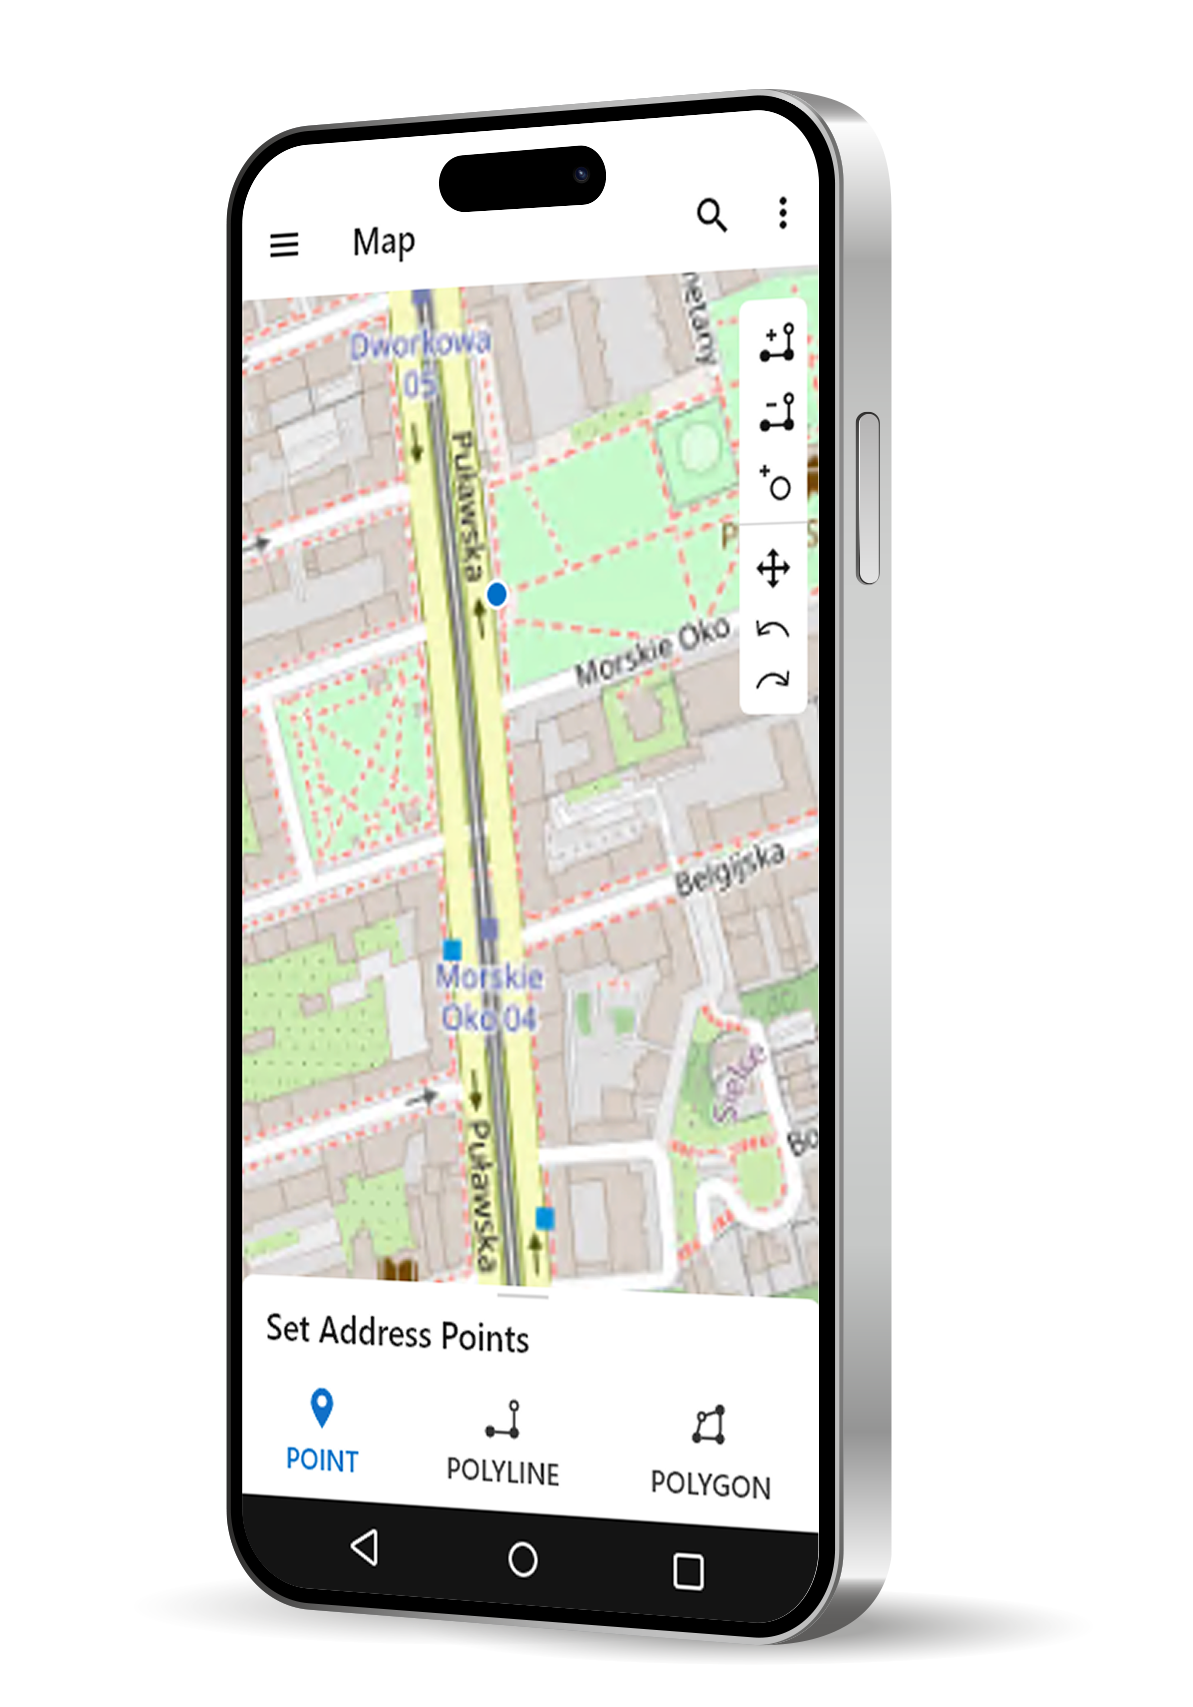
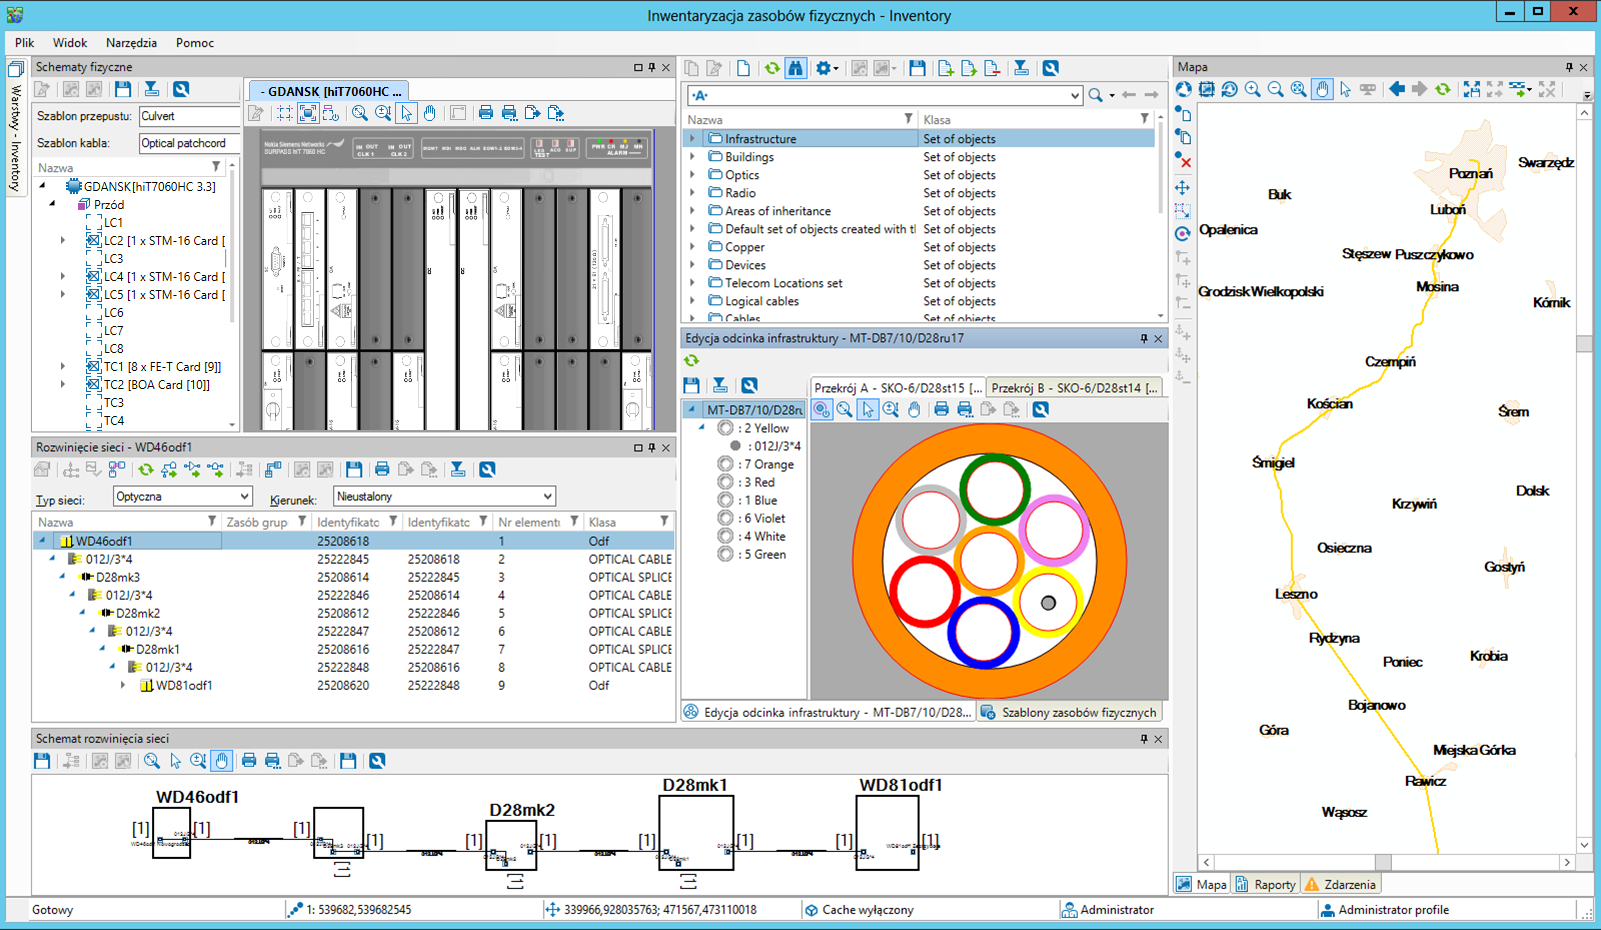
- Outside Plant on a GIS map: record buildings, cabinets, chambers, manholes/handholes, poles, duct routes and duct segments, including assets that are owned and leased.
- Inside Plant in floor plans and equipment views: document what is installed in a site down to the exact room layout, rack position and port.
This makes it easy to move from a high-level geographic view to a precise technical view—without losing context.
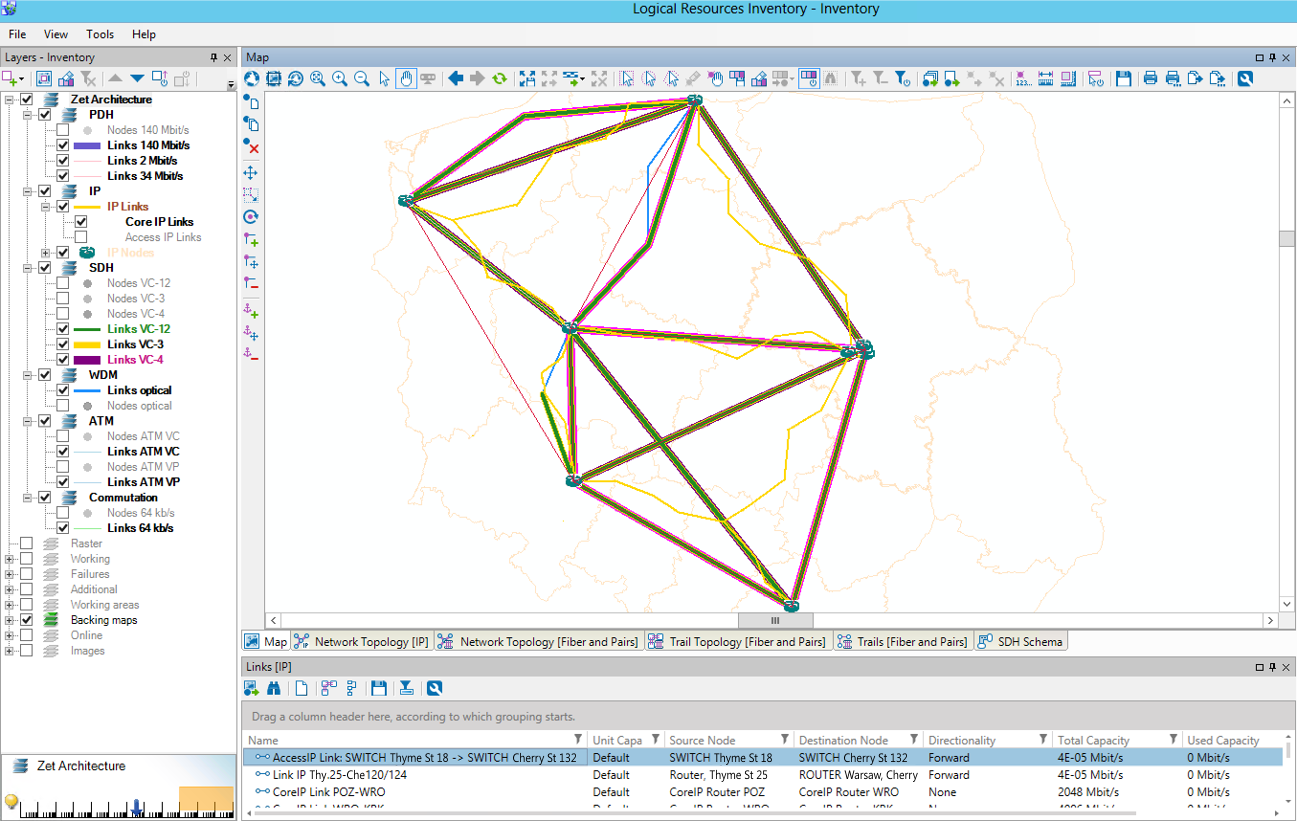
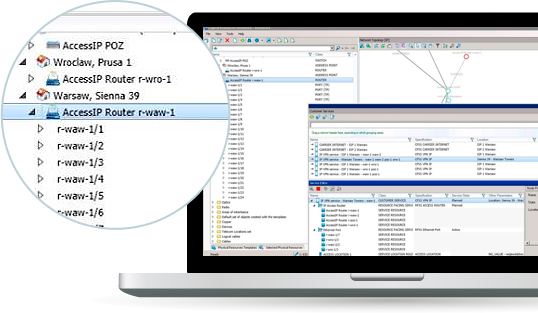
A connectivity model you can trust
Physical Network Inventory is built around connectivity, not just an asset list. It stores and relates:
- Optical, copper and coax cables with full structure information (fibers/pairs, tubes, colors and other parameters)
- Containment and routing such as duct sections, sub-ducts, risers and overhead spans
- Junctions and terminations, including splice closures, splicing details and cable reserves (slack) at key points in the network
- Strengthens connectivity confidence by combining accurate topology and port-level modeling with built-in engineering analysis (e.g., PON optical loss calculations and HFC signal/power verification), so designs and operational decisions are based on validated network behavior rather than assumptions.
Because assets and connections are modeled together, you can trace how the network is built, how it is used, and what is available—without guesswork.
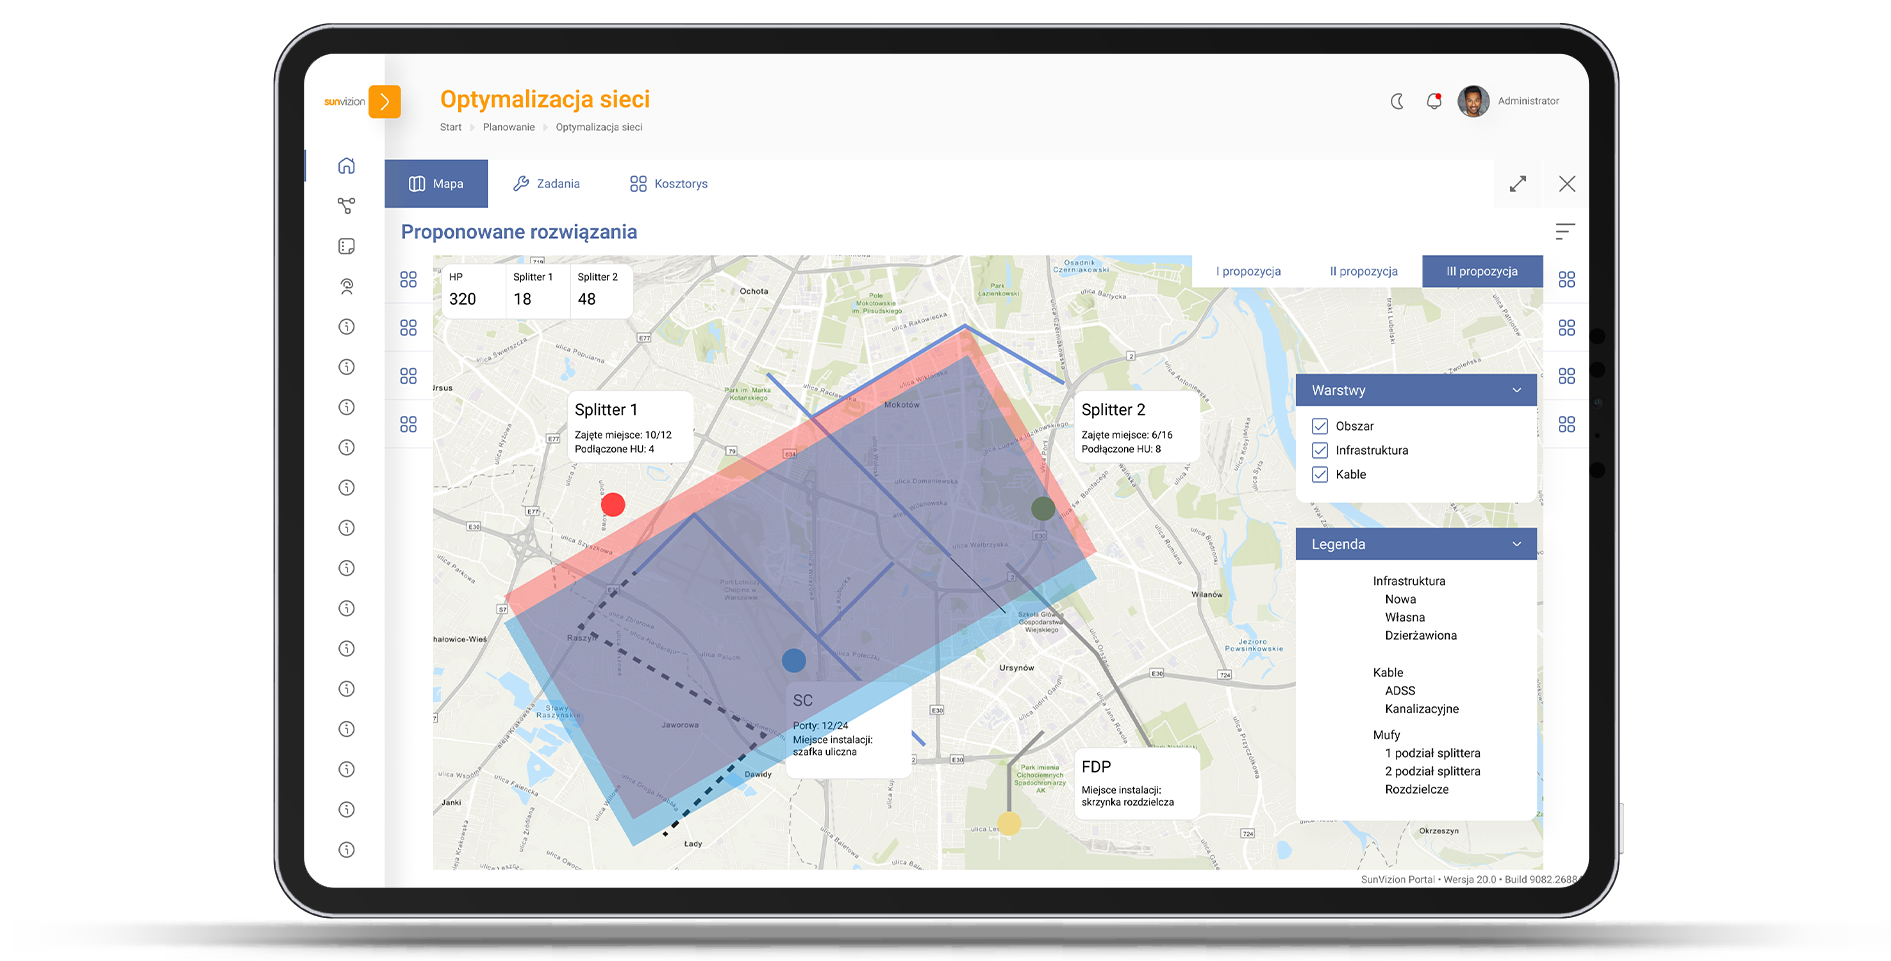
Occupancy and capacity control where it matters most
A common cause of rollout delays is “capacity that exists on paper, but not in reality.” SunVizion addresses this by tracking real utilization of physical resources, including:
- Duct and conduit occupancy and remaining space for new cables
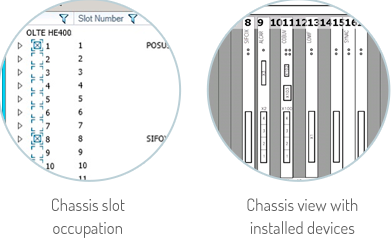
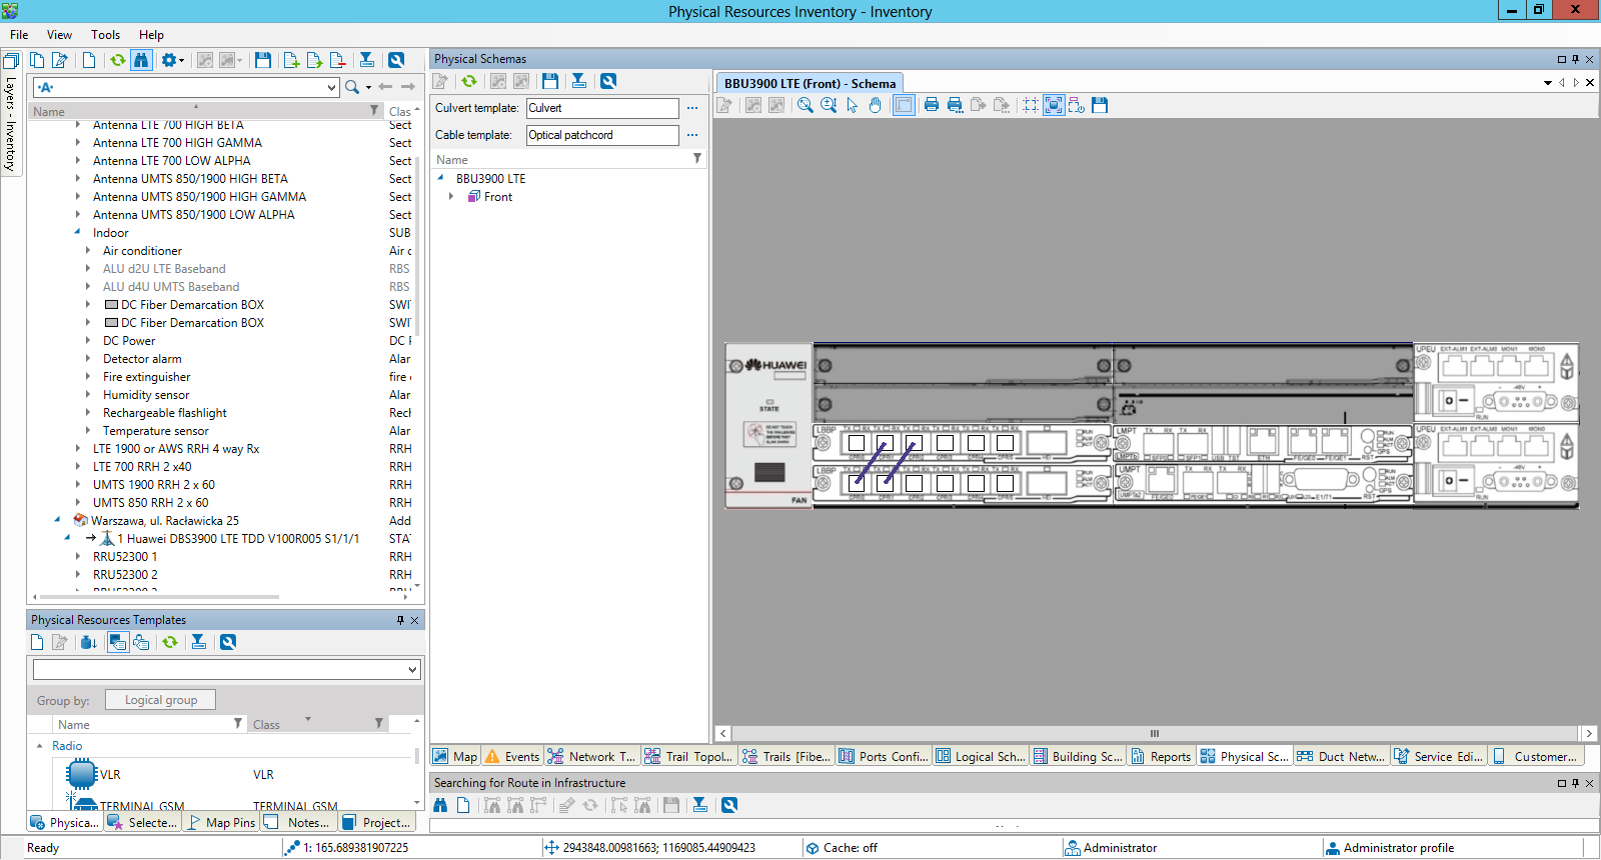
- Rack and shelf occupation, including card placement
- Port states and port-level connections
- This supports confident decisions such as whether a new cable can be routed through a specific duct section, whether there are enough spare fibers, or whether a port is actually free for service delivery.
 Network Failure Analysis and service impact visibility
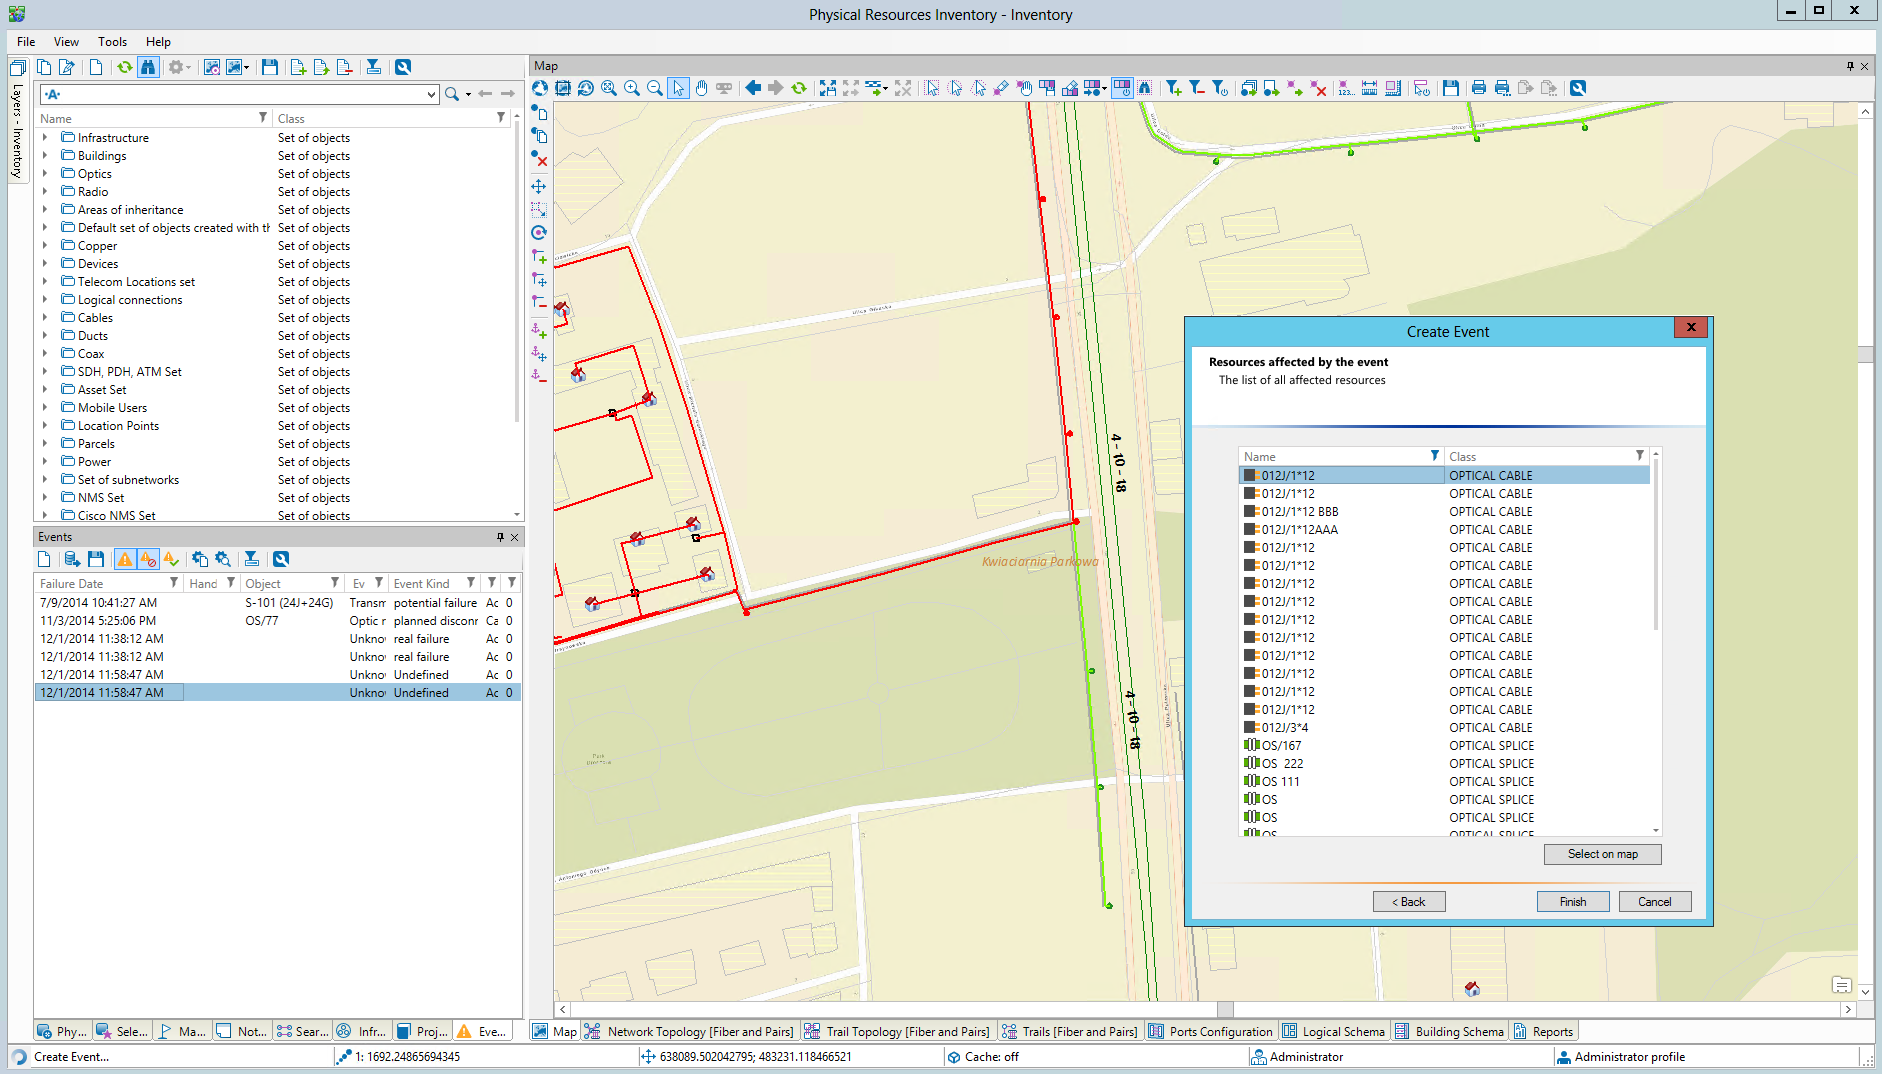
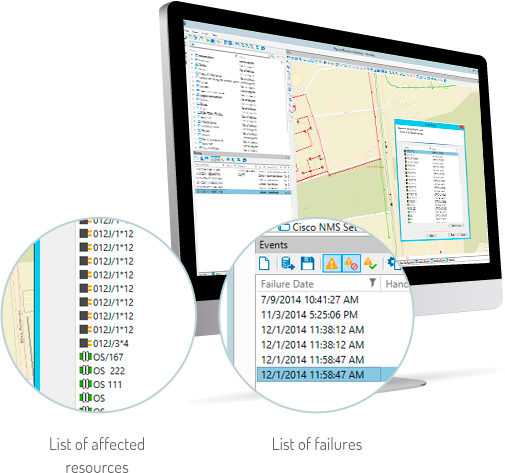
SunVizion records planned and unplanned events (maintenance, outages, repairs) and helps teams identify the failure area on the map, understand consequences in the network, and analyze impact on affected connections and services. It supports planned disconnections with outcome tracking, helps control SLA commitments (e.g., restoration/repair targets), and provides reporting on current incidents as well as historical failure rates for selected network elements.
- Identifies failure consequences and shows their impact on the network and—when service relationships are available—on the services delivered to end users.
- Manages planned disconnections and maintenance windows, and analyzes the outcomes to confirm what was affected and what was restored.
- Helps control SLA commitments by monitoring incident and restoration timelines against agreed targets.
- Provides operational reporting on current incidents and historical failure rates for network elements to support trend analysis and prioritization.
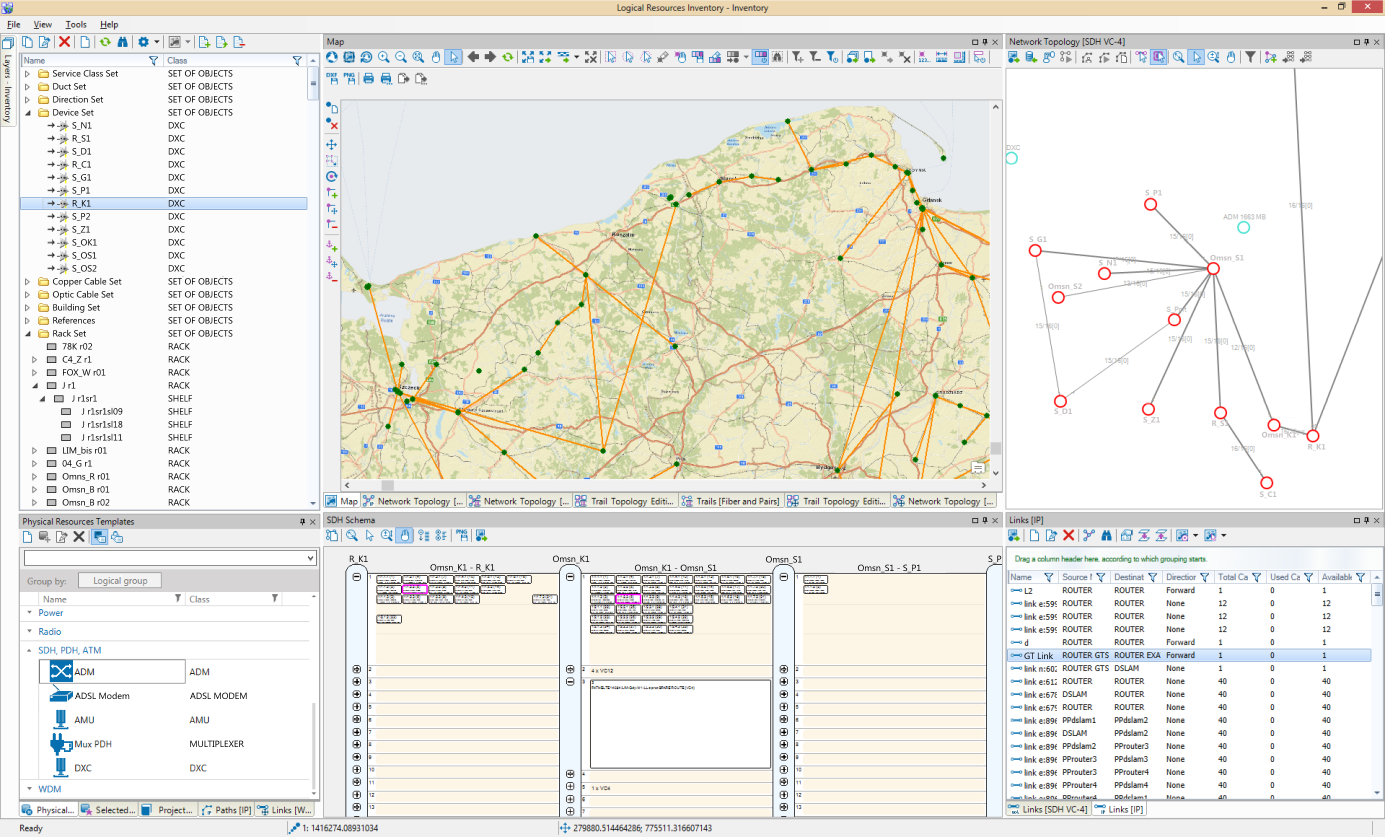
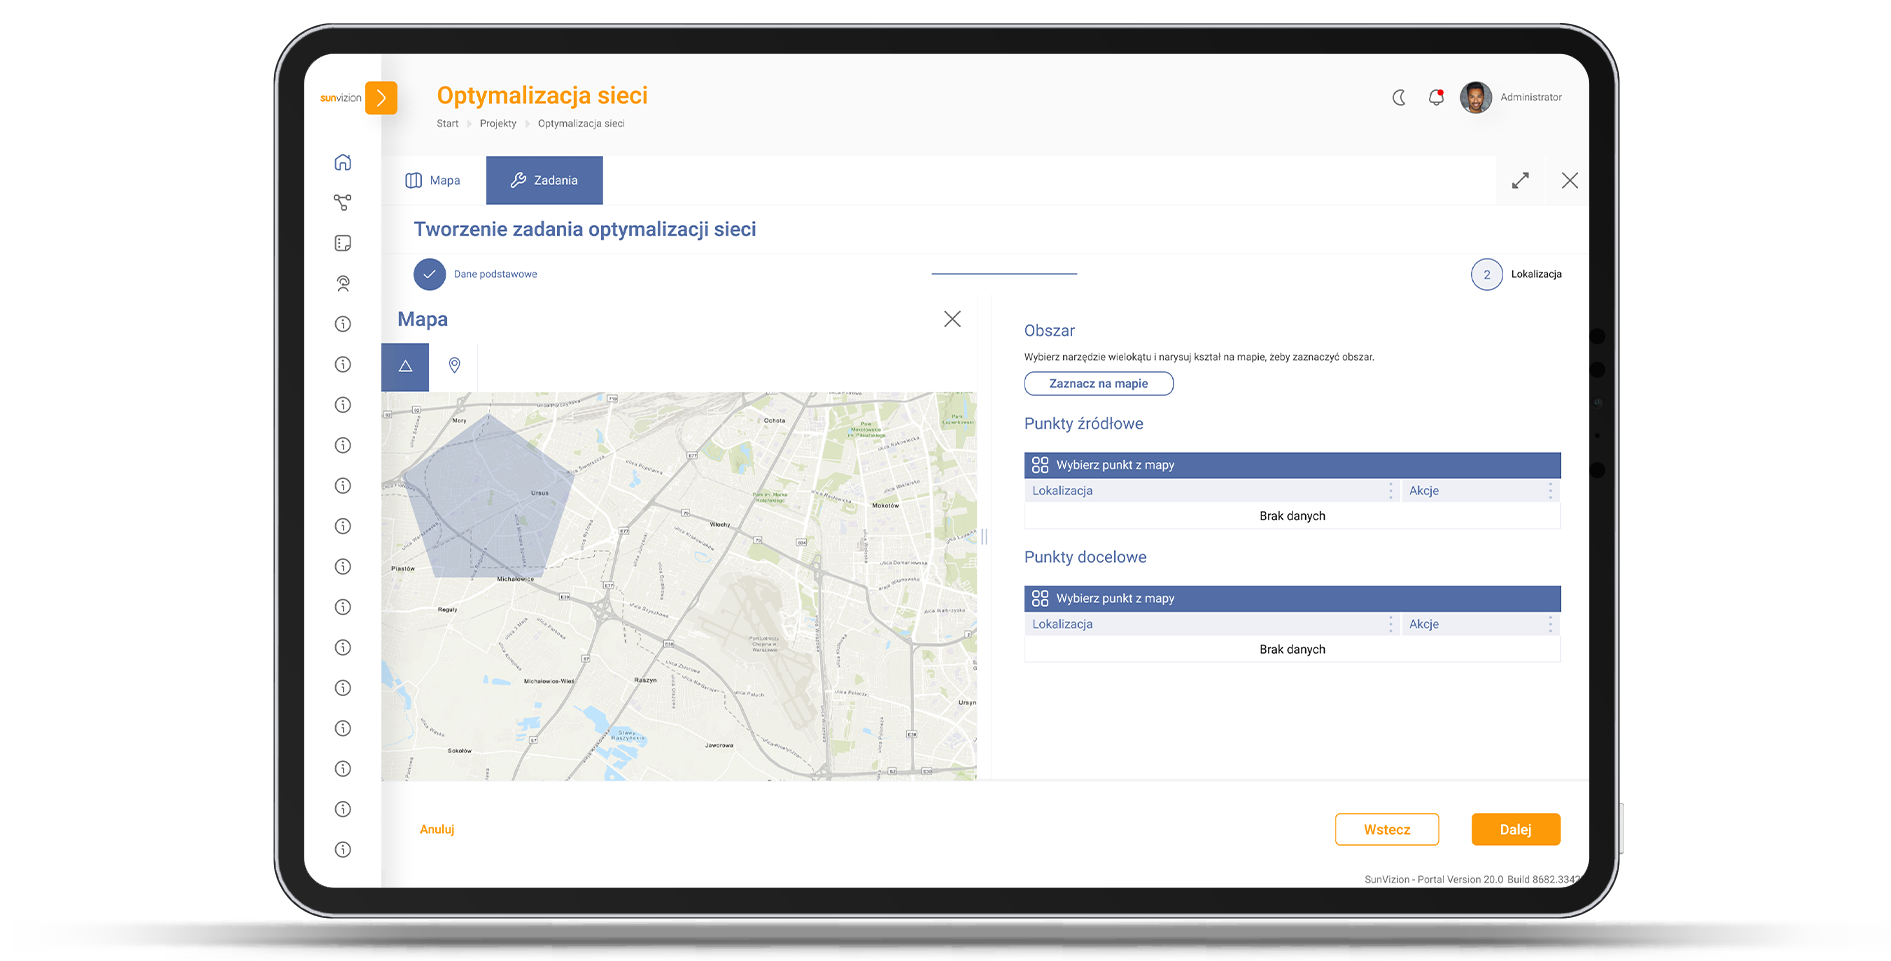
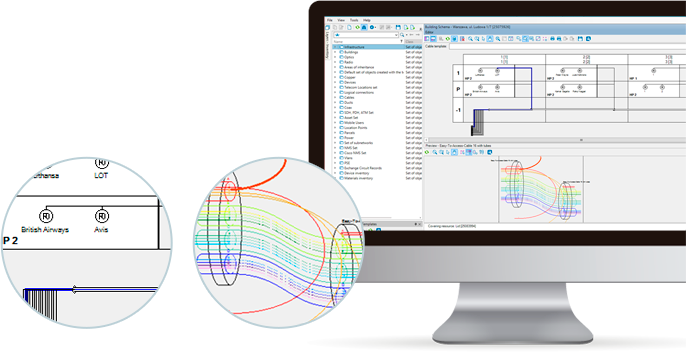
Optical and copper topology, from strands to end-to-end routes
For fiber and copper networks, SunVizion manages topology and usage at the level needed for real operations:
- Available and used fibers/pairs and their capacity
- Splices and splice closures that define real connectivity
- Trails representing end-to-end routes and their utilization over underlying cables/fibers
Trails can be created manually, but the system also supports automated route finding—including shortest path, least-cost path, alternate route search, and the ability to find two or more diverse paths. This is particularly valuable for leased connections, resilience planning and faster service turn-up.
3D network view for better spatial understanding
SunVizion can present your inventory in a 3D view, combining terrain elevation, buildings and network assets into one spatial model. This makes it much easier to understand how infrastructure is laid out in dense urban areas, complex sites, or underground corridors—without relying on multiple drawings or site visits.
With 3D visualization you can:
- Review how assets are positioned above and below ground,
- Validate distances and heights with a few clicks,
- Display 3D models of infrastructure elements such as pipelines and manholes,
- Build a more accurate understanding of the site before sending field teams.
Augmented Reality for field teams: see hidden assets on site
Physical Network Inventory stores geo-located assets such as ducts, manholes, towers and cables. SunVizion can leverage this data to provide Augmented Reality (AR) capabilities—so field staff can visualize inventory data directly on site, in context.
AR is especially useful for:
- Underground assets that are normally invisible (e.g., ducts and manholes/handholes),
- Above-ground assets such as aerial cables on poles,
- Asset identification and enrichment, showing key details like asset name/ID,
- Containment and hierarchy, e.g., a splice case inside a pit or a cable inside a duct.
Where assets have only 2D coordinates (a common case in legacy databases), SunVizion can apply default height or depth values (e.g., standard cable height above ground or duct depth below ground) to enable practical AR visualization.
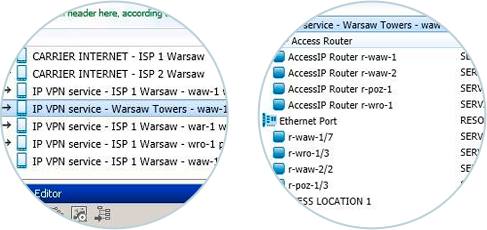
Works even better with Logical Inventory
When combined with SunVizion Logical Resource Inventory, failure and event analysis can be extended beyond physical assets to include logical relationships, bandwidth and service-facing dependencies. This gives teams a clearer view of how network incidents translate into service impact and helps prioritize restoration based on what matters most.
Benefits
Provides one reliable source of truth for physical network assets across Outside Plant and Inside Plant—so teams always work on the same, consistent data set.
Speeds up fault resolution by pinpointing affected assets on the map, tracing impact through connectivity, and guiding restoration priorities with clear visibility of what’s down and why.
Reduces rollout risk by tracking duct/conduit, rack and port occupancy, making available capacity visible before you commit to a design or an installation.
Speeds up engineering and operations by linking assets into real connectivity (cables, fibers/pairs, splices, ports), not just standalone records.
Improves service delivery readiness by showing actual spare fibers/pairs, port states and physical connections needed to activate or troubleshoot services.
Enables fast end-to-end tracing through optical and copper topology, including trails that represent real route usage over underlying cables and fibers.
Supports resilience and cost control by creating trails manually or automatically using route-finding algorithms (shortest, least-cost, alternate and diverse paths).
Increases engineering confidence with built-in PON optical loss analysis, including attenuation and signal level calculations that can be exported to documentation.
Helps field teams work faster and safer with 3D visualization and Augmented Reality, making underground and above-ground assets easier to understand and identify on site.